
Figure 2.
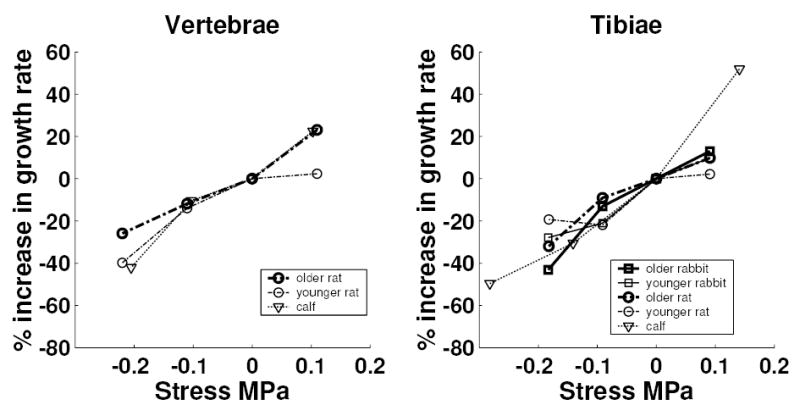
Relationship between applied stress and the percentage alteration in growth (relative to control) for the growth plates at 2 anatomical sites. The mean values from provisionally five animals are plotted. In each case, the mean values obtained from sham animals were subtracted (hence all mean values at 0 MPa are zero).