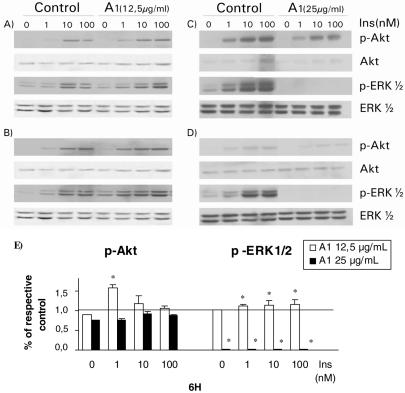
Figure 2.
Concentration-dependent effects of methanolic almond extract on major insulin-signaling pathways. HTC cells cultured for 6 h (A and C) and 21 h (B and D) in the presence of 12.5 μg ml−1 (A and B) or 25 μg ml−1 (C and D) of A1 extract. Treated or control cells were then stimulated with indicated concentrations of insulin (Ins) after treatment by A1 extract. The cells were lysed and 20 μg of SDS-lysis protein extract were used for western blot analysis as described in the Materials and Methods section. Proteins immunoreactive to antibodies raised against the phosphorylated forms of ERK1/2 (p-ERK1/2) and PKB/Akt (p-Akt) were revealed by enhanced chemiluminescence as described in the Materials and Methods section. The non-phosphorylated proteins were revealed on stripped membrane as loading controls. Results are representative of three separate determinations. Densitometric analysis of results with 6 h treatment with both concentrations of A1 extract is presented in panel E. Values obtained with A1 are presented relative to their respective DMSO controls at each insulin concentration. Statistically different from respective DMSO control, *P < 0.05.

