
Figure 3.
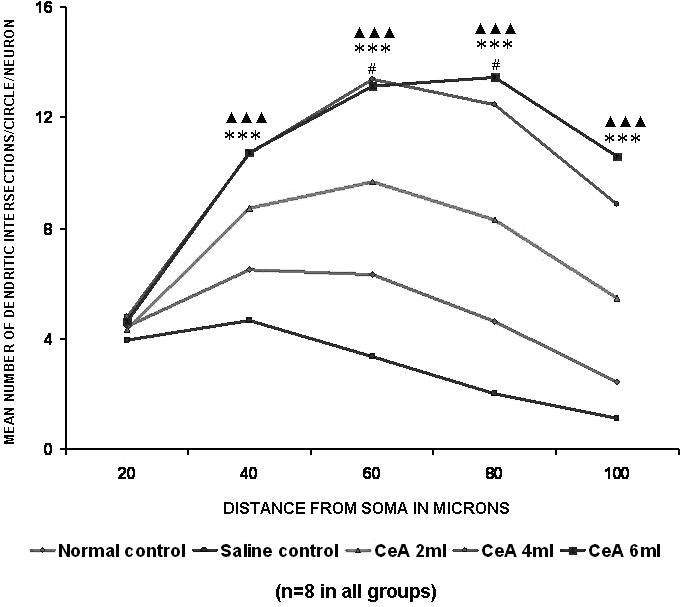
Basal dendritic intersections of hippocampal CA3 neurons in rats treated with 2, 4 and 6 ml kg−1 body weight of CeA for 6 weeks and in age-matched control and saline treated rats. Each point represents the mean of 8–10 neurons from each rat (SD not shown). F-value: 0.73, 38.64, 58.37, 60.64 and 33.0 at 20, 40, 60, 80 and 100 μm distance from the soma, respectively. Note that there is a significant increase in the dendritic intersections in rats treated with 2, 4 and 6 ml kg−1 CeA. Normal control versus 2 ml kg−1 CeA: #P< 0.05; normal control versus 4 ml kg−1 CeA: ***P < 0.001; normal control versus 6 ml kg−1 CeA: ▴▴▴P < 0.001 (one-way ANOVA, Bonferroni's test).