
Figure 4.
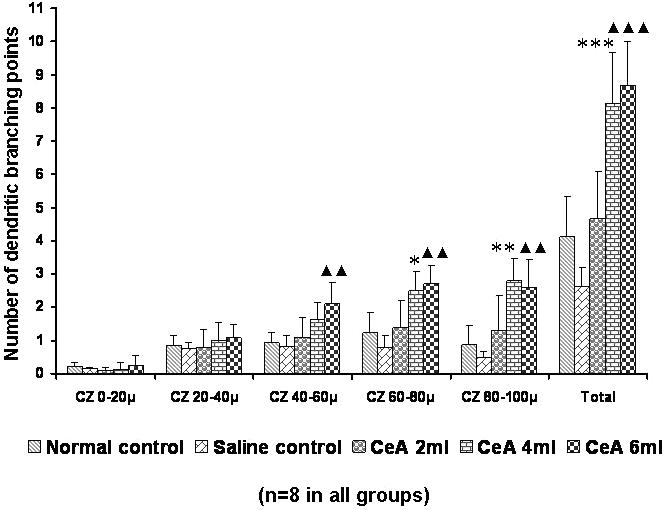
Apical dendritic branching points in the hippocampal CA3 neurons of rats treated with 2, 4 and 6 ml kg−1 body weight of CeA for 6 weeks and in age-matched control and saline treated rats at concentric zones (CZs) and total number of branching points. Each value represents the mean + SD of 8–10 neurons from each rat. F-value: 0.91, 0.98, 9.70, 15.63, 16.24 and 35.43 at the 0–20, 20–40, 40–60, 60–80 and 80–100 μm CZs and total number of branching points, respectively. Note the significant increase in dendritic branching points in 4 and 6 ml kg−1 CeA treated rats compared with control rats. Normal control versus 4 ml kg−1 CeA: *P < 0.05, **P < 0.01, ***P < 0.001; normal control versus 6 ml kg−1 CeA: ▴▴P < 0.01, ▴▴▴P < 0.001 (one-way ANOVA, Bonferroni's test).