Figure 1.

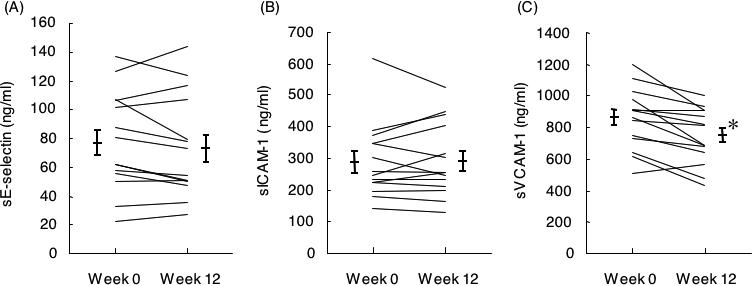
Plasma levels of sE-selectin (A), sICAM-1 (B), and sVCAM-1 (C) at baseline and 12 weeks after administration of KBG. Data represent mean ± SE (n = 14), *P < 0.01 compared with baseline.

Plasma levels of sE-selectin (A), sICAM-1 (B), and sVCAM-1 (C) at baseline and 12 weeks after administration of KBG. Data represent mean ± SE (n = 14), *P < 0.01 compared with baseline.