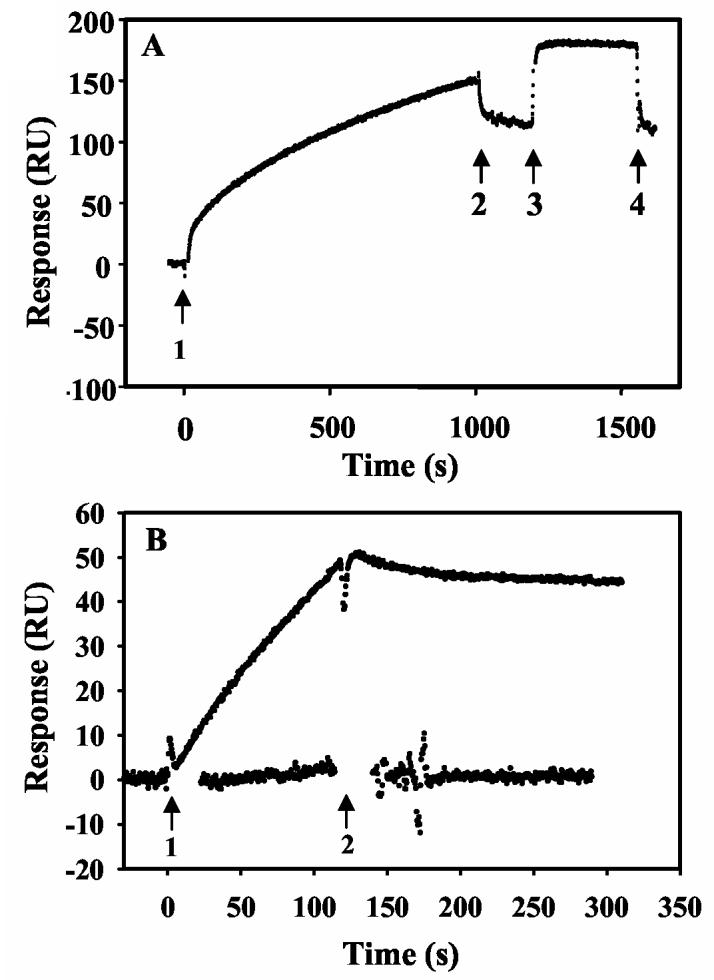
Figure 4.

Effects of DNA binding on PutA membrane associations. Panel A: Oxidized PutA (100 nM) in the presence of sodium lactate (5 mM) was injected onto a L1 chip coated with E. coli polar lipid vesicles (arrows 1 and 2). The lipid-bound PutA was then washed with HEPES-N buffer at 60 μl/min for 180 s (arrows 2-3) followed by injection of put control DNA (419 bp, 20 nM) (arrows 3-4). The rapid change in RU at the beginning of the injection of DNA is due to the refractive index change of DNA sample, not to PutA-DNA binding. The RU returned to the initial value after the injection of the DNA sample was complete. Panel B: Sensorgrams of the PutA (10 nM)-oligonucleotide (1.8 μM) complex (upper trace) and the PutA (10 nM)-put control DNA (300 nM) complex (lower trace) injected onto a L1 chip coated with E. coli polar lipid vesicles in the presence of 5 mM proline (arrows 1 and 2).
