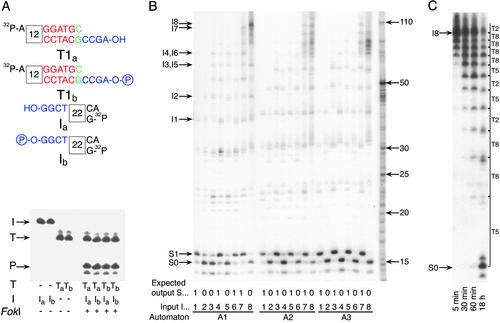
Figure 3.
Experimental results and mechanism analysis of the molecular automaton. (A) A demonstration that a computation does not require ligase. Different variants of the software molecule T1 (T1a, nonphosphorylated, and T1b, phosphorylated) and the input (Ia, nonphosphorylated and Ib, phosphorylated) were incubated with the hardware (FokI) at 8°C for 10 min. Input, software, and hardware concentrations were all 1 μM. Reaction components are shown below the lanes, and the locations of software molecule (T), input (I), and product (P) are indicated by arrows. (B) Executing automata A1–A3 (Fig. 1 A and C) on inputs I1–I8 (Fig. 1D). Input, software, and hardware concentrations were 1, 4, and 4 μM, respectively. Reactions were set in 10 μl and incubated at 8°C for 20 min. Each lane contains inputs, intermediate configurations, and output bands at the indicated locations. The programs, inputs, and expected outputs are indicated below each lane. Location of unprocessed input is shown on the left. Size markers are indicated by arrows on the right. (C) Software reusability with the four-transition automaton A1 applied to input I8 with each software molecule taken at 0.075 molar ratio to the input. Input, software, and hardware concentrations were 1, 0.3 (0.075 μM each kind), and 1 μM, respectively. After 18 h, molecules T2, T5, and T8 performed on the average 29, 21, and 54 transitions each. Input and output locations are indicated on the left, and intermediates and software molecules applied at each step are on the right.

