
FIG. 9.
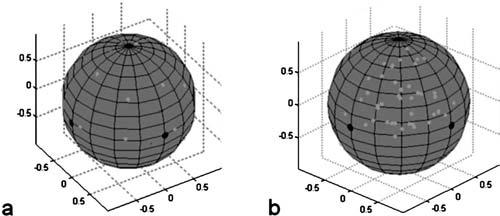
Experimentally obtained directional force data. The large black dots indicate pole locations and light grey dots indicate force directions (directions in which the bead was pulled). Axis of symmetry data (a) where forces were applied towards each pole, in between two poles, and in between three poles. (b) shows one octant of pole excitations.