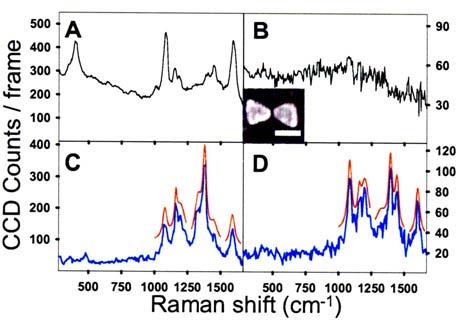
FIG. 1.

(Color online) (A) Bulk SERS spectrum of pMA on roughened Au (10 s integration); (B) fluorescence continuum from a bowtie without adsorbed pMA. A representative SEM image, inset (scale bar=100 nm, 17 nm gap); (C) SERS for pMA on a bowtie (2 s integration) at t=326 s; (D) SERS from the same bowtie at t=441 s. Spectra (C) and (D) differ in observed SERS modes and total intensity. Red curves in (C) and (D) are Lorentzian fits for modes between 1000 and 1600 cm−1, offset for clarity. I=155 kW/cm2.
