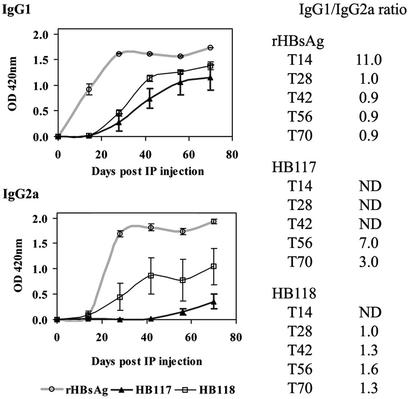
Figure 6.
IgG1 and IgG2a levels in mice of Fig. 5 immunized with yeast or plant-cell HBsAg. The serum from each mouse was diluted 1:100 for reaction with yeast rHBsAg. The IgG1 and IgG2a were reported as a mean of OD420 from five mice of each group. The IgG1/IgG2a ratio was calculated by dividing the mean OD of IgG1 by that of IgG2a. ND, not determined when OD420 of either IgG1 or IgG2a was <0.05.

