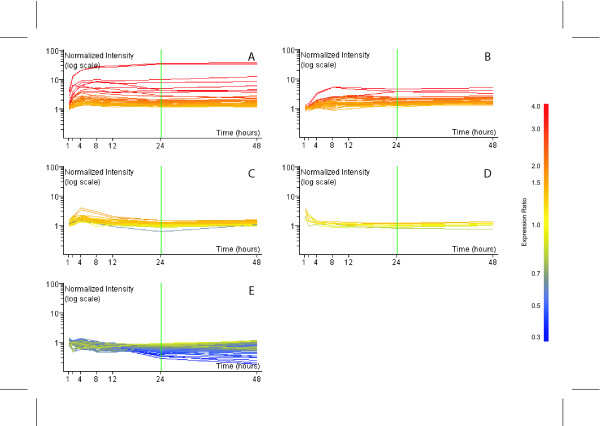
Figure 3.
K-means clustering of temporally differentially regulated genes in vitro. Five k-mean clusters corresponding to (A) up-early and sustained, (B) up-intermediate and sustained, (C) up-regulated intermediate, (D) up-regulated immediate and (E) down-regulated late. Time and expression ratio are indicated on the x- and y-axis respectively. The color of individual gene expression profiles reflects the expression ratio observed at 24 hrs

