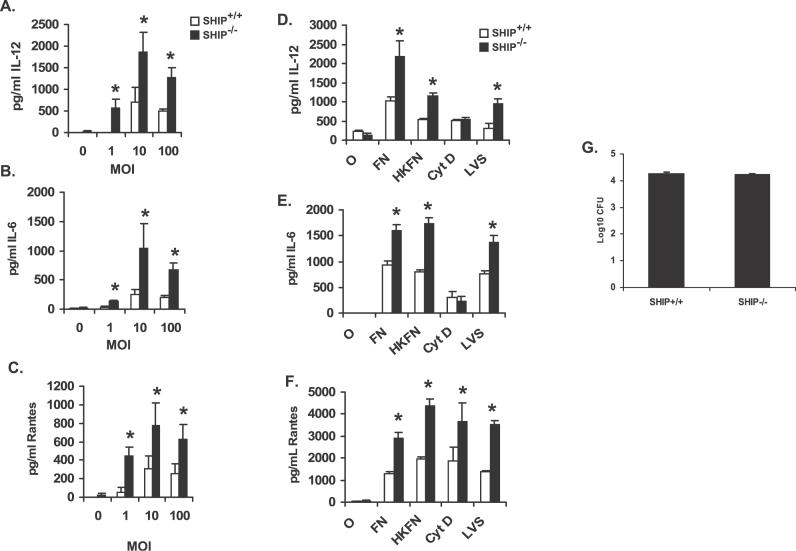
Figure 2. Analysis of SHIP Influence on Macrophage Inflammatory Response to F. novicida Infection.
(A–C) BMMs from SHIP+/+ and SHIP−/− littermate mice were infected at different MOI (indicated in figure) of F. novicida for 8 h. Cytokine levels were measured in uninfected samples (0 h). Cell supernatants from uninfected and infected cells were assayed for IL-12, IL-6, and RANTES by ELISA.
(D–F) BMMs from SHIP+/+ and SHIP−/− littermate mice were infected with 100 MOI of live or heat-killed F. novicida (FN and HKFN, respectively) or with F. tularensis LVS (LVS) for 8 h. Cyt D represents samples that were treated with cytochalasin D (5 μg/ml) before infection with 100 MOI of live F. novicida. Cytokine levels were measured in uninfected samples (0 h). Cell supernatants from uninfected and infected cells were analyzed by ELISA for IL-12, IL-6, and RANTES.
(G) BMMs from SHIP +/+ and SHIP−/− littermate mice were infected with 100 MOI of F. novicida for 2 h, then treated with gentamicin (50 μg/ml), lysed in 0.1% SDS and appropriate dilutions of the lysates were plated on Chocolate II agar plates for enumeration of CFUs. All graphs represents mean and SD of values obtained from three independent experiments. Data were analyzed by paired Student t test. An asterisk (*) indicates p-value < 0.05.

