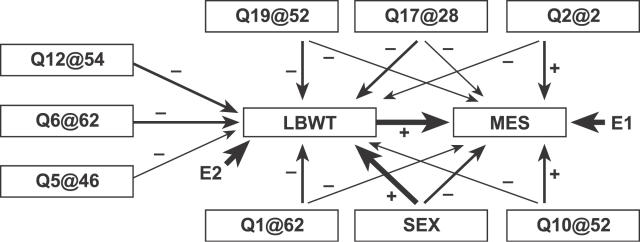
Figure 4. Graphical Representation of the SEM for Mesenteric Fat Pad Weight.
Genetic loci are indicated by Q followed by the chromosome number, and @ followed by the cM position of the LOD peak. Single-headed arrows indicate causal paths, and the thickness of each arrow is proportion to the effect size (path coefficient). A negative sign from a QTL to a trait indicates that the NZB allele is associated with high trait values. E1 and E2 denote unobserved residual error.

