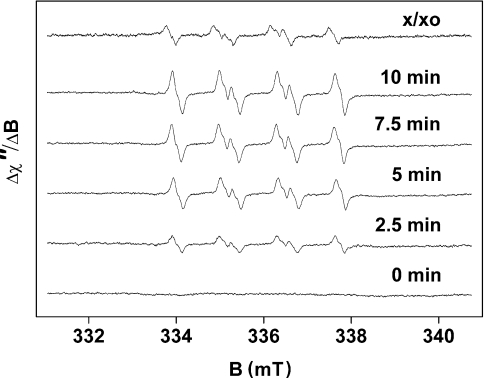
Figure 1. Light-induced EPR spectra of the EMPO-OOH adduct measured in spinach PSII membrane particles after illumination for the time indicated.
EPR spectra were obtained after illumination of PSII membrane particles with white light (900 μE·m−2·s−1) in the presence of 25 mM EMPO, 100 μM desferal, 150 μg of chl·ml−1 and 40 mM Mes (pH 6.5). The upmost trace labelled x/xo shows the EPR signal of the EMPO-OOH adduct generated by xanthine/xanthine oxidase system.

