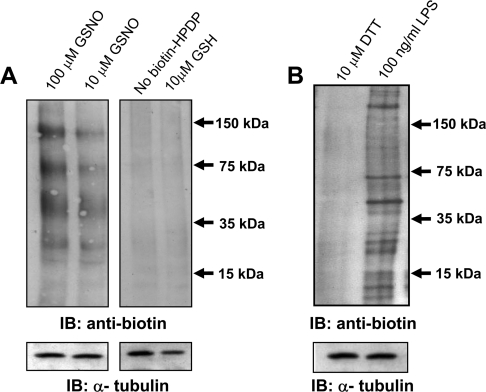
Figure 4. S-nitrosylation of proteins detected by the biotin-switch assay.
(A) Left-hand panel: N293 cells were incubated with 100 μM and 10 μM GSNO for 1 h and subjected to the S-nitrosylation assay (see the Materials and methods section). Right-hand panel: N293 cells were treated with 10 μM GSNO but not treated with biotin–HPDP or the control compound glutathione, followed by analysis of S-nitrosylation. In these samples only the endogenous biotinylated proteins are detectable. (B) S-nitrosylation was measured in RAW 264.7 macrophage cells treated with the iNOS inducer LPS (100 ng/ml) or the reducing agent DTT (10 μM). The expression of α-tubulin is included as a protein loading control. The results shown are representative of three independent experiments. IB, immunoblot.

