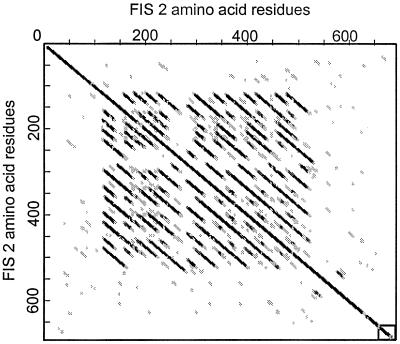
Figure 3.
Bi-dimensional plot of the FIS2 predicted protein sequence showing the tandem repeats between residues 120 and 520. Within the matrix, the dark dots indicate high homology and open dots indicate no significant homology. The dot matrix was obtained using the software antherprot 3.2 (35) with a window size = 19 and a similarity threshold = 10. The principle of the method is described in Staden (1982) Nucleic Acid Res. 10, 2951–2961.

