
Figure 4.
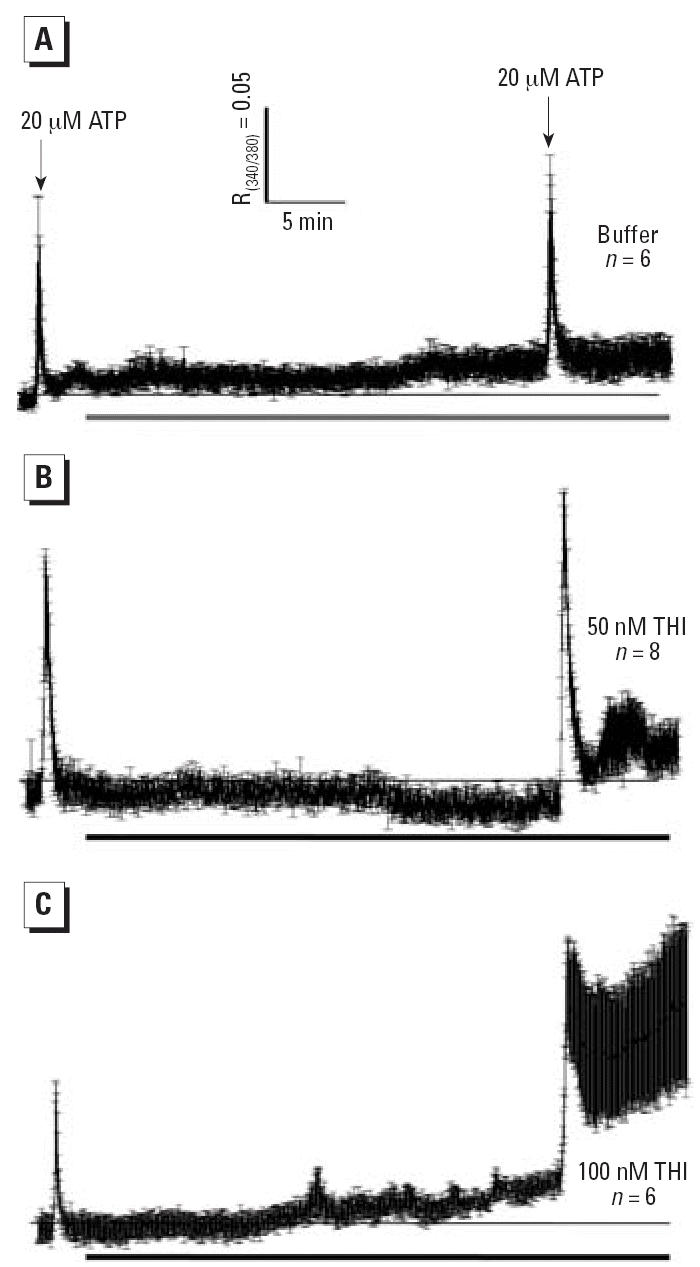
Ca2+ transients elicited in IDCs by ATP before and after 20 min exposure (bars beneath traces) to buffer (A), 50 nM THI (B), or 100 nM THI (C). DCs were given 20 μM ATP (5 sec, first arrow) 1 min after the start of trace recording. The cells were challenged a second time with ATP, and traces were recorded 8 min. Thin horizontal lines indicate the initial baseline. R340/380 ratiometric data were acquired every 2 sec. Traces are the mean ± SE and represent two experiments.