Figure 1.

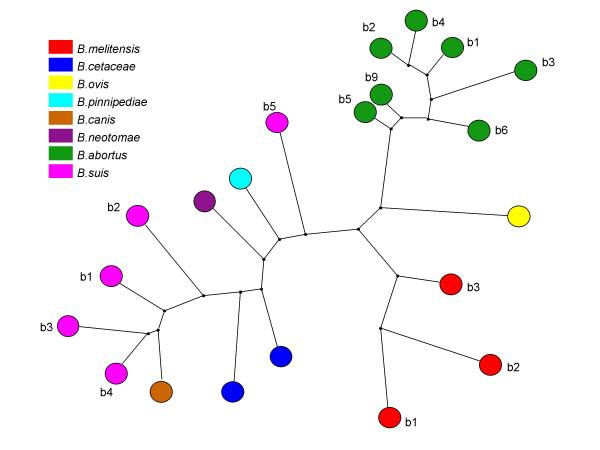
Maximum parsimony analysis, on 21 reference strains using data from all 71 markers. The different species are represented by different colours, as indicated. Biovars (b) are mentioned wherever relevant.

Maximum parsimony analysis, on 21 reference strains using data from all 71 markers. The different species are represented by different colours, as indicated. Biovars (b) are mentioned wherever relevant.