
Figure 1.
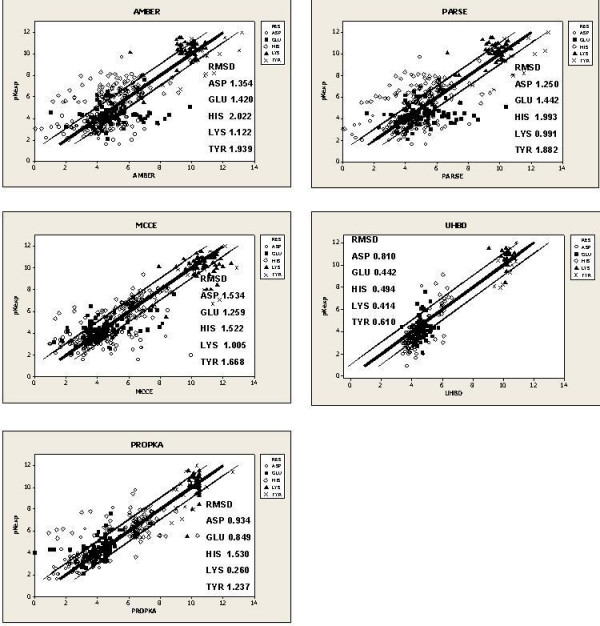
Correlation plots for the individual programs. The bold line indicates perfect prediction (pKpred = pKexp). The outer lines indicate +/- 1 unit from the pKexp.
Official websites use .gov
A
.gov website belongs to an official
government organization in the United States.
Secure .gov websites use HTTPS
A lock (
) or https:// means you've safely
connected to the .gov website. Share sensitive
information only on official, secure websites.
Correlation plots for the individual programs. The bold line indicates perfect prediction (pKpred = pKexp). The outer lines indicate +/- 1 unit from the pKexp.