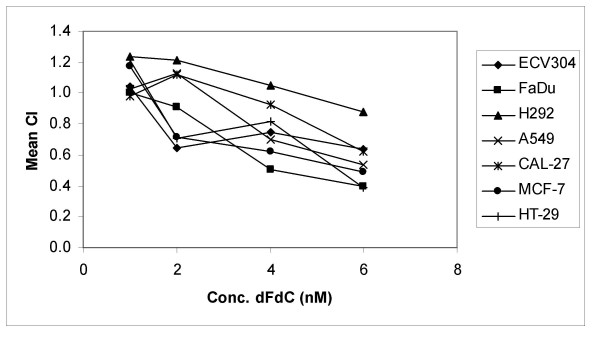
Figure 3.

Relationship between gemcitabine concentration and the combination index. Relationship between the concentration of gemcitabine (dFdC) and the mean combination index (CI) for ECV304, FaDu, H292, A549, CAL-27, MCF-7 and HT-29 cells. The cells were treated during 24 h with gemcitabine immediately before radiotherapy (0–8 Gy). A CI value between 0.9 and 1.1 indicates only additivity. Moderate synergism is depicted by CI values between 0.7 and 0.9, synergism by CI values below 0.7.
