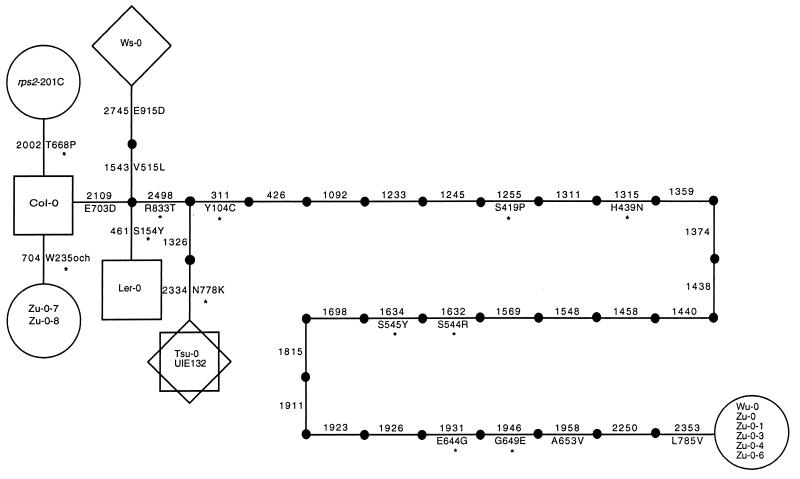
Figure 2.
Gene tree depicting the nucleotide differences between all haplotypes. Each step represents a point mutation leading to a nucleotide change. Numbers refer to the nucleotide where a change occurred (where number 1 defines the first nucleotide in the coding sequence). Amino acid changes are indicated along with the amino acid number. Nonconservative changes are marked by an asterisk. For convenience, the Col-0 sequence is used as a reference for amino acid changes. The tree is unrooted and no evolutionary direction is implied. Phenotypes corresponding to each haploytpe are classified as follows: ○, susceptible; □, resistant; ⋄, partially resistant.

