
Figure 3.
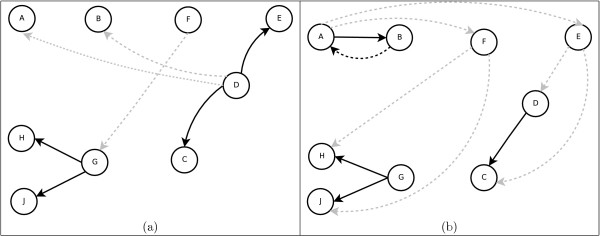
The interactions inferred from unperturbed data. The interactions inferred from unperturbed data (12 slices; the network restricted to 9 genes): (a) by our exact algorithm with self-loops forbidden (the edges occurring in each network with the optimal score) and (b) by Markov chain Monte Carlo method [17]; black arrows show true inferred edges (solid arrows refer to transcriptional regulation and dashed refer to interactions triggered by the ligand and posttranscriptional regulation), grey dashed arrows represent spurious edges.