
Figure 4.
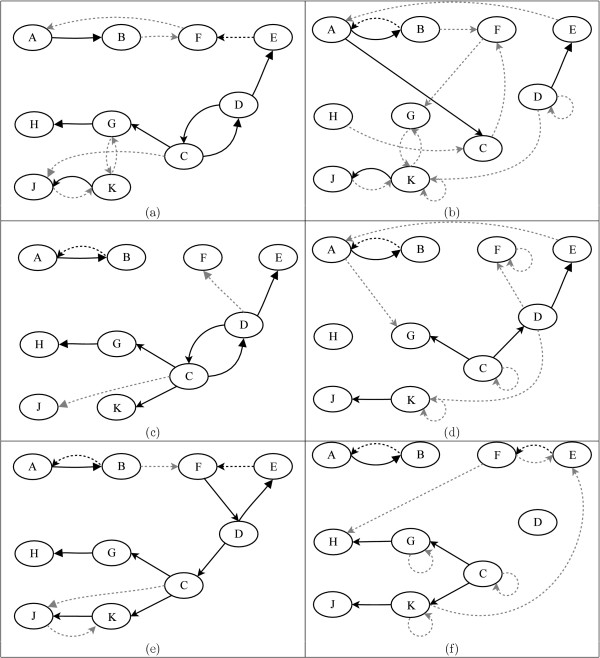
The interactions inferred from perturbed data. The interactions inferred from perturbed data: (ab) 10 knockout series, each with 12 slices, (cd) 10 knockout series, each with 3 slices, (ef) 10 knockout and 10 overexpression series, each with 3 slices; black arrows show true inferred edges (solid arrows refer to transcriptional regulation and dashed refer to interactions triggered by the ligand and posttranscriptional regulation), grey dashed arrows represent spurious edges. The networks (ace) are obtained by our exact algorithm with self-loops forbidden (if there are many networks with the optimal score, the edges occurring in each one are shown) and the networks (bdf) by the MCMC method [17].