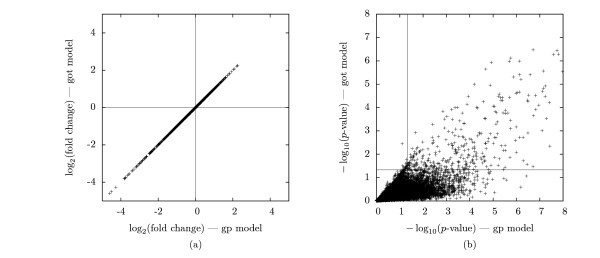
Figure 2.

Comparison of GP and GOT models. Comparison of estimated log2(fold change) and the corresponding p-value estimates for the GP and GOT model results of the WS ecotype values in Table 4 (a) This is a scatter plot of the estimated log2(fold change) values from the GP and GOT models; these values are essentially identical, (b) This is a scatter plot of the - log10 (p-value), again for the GP and GOT models. The dotted lines correspond to - log10(0.05), as our significance cutoff is 0.05. For the GP model, it is the points to the right of the dotted line that are significant. For the GOT model, it is the points above the dotted line that are significant.
