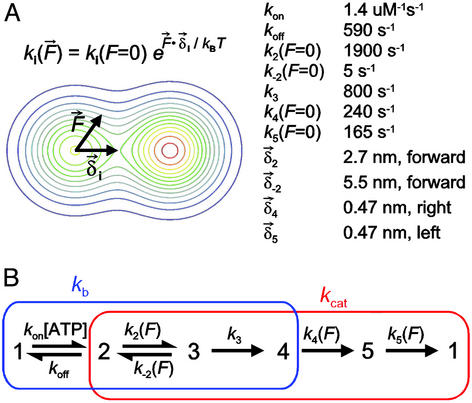
Figure 2.
Model of the kinesin mechanochemical cycle. (A Left) A schematic diagram illustrating how force affects the transition rates involving motion. The application of load tilts the energy landscape (shown as a contour plot) along the direction of loading, changing the passage rate over the barrier according to the relation shown, where F⃗ ⋅ δ⃗i is the dot product of the force vector, F⃗, and the vector from the starting to the transition state, δ⃗i, pointing along the reaction coordinate. (A Right) Rate constants derived from a global fit of this reaction scheme to the data of Figs. 3 and 4 (see Materials and Methods). (B) A hypothetical five-state reaction scheme in which the transitions from 1→4 (blue rectangle) contribute to the MM parameter kb, whereas the transitions from 2→1 (red rectangle) contribute to kcat. The transition from 2↔3 involves a relatively large motion along the microtubule, whereas transitions from 4→5 and 5→1 involve smaller motions perpendicular to the microtubule that are equal in magnitude and opposite in direction.

