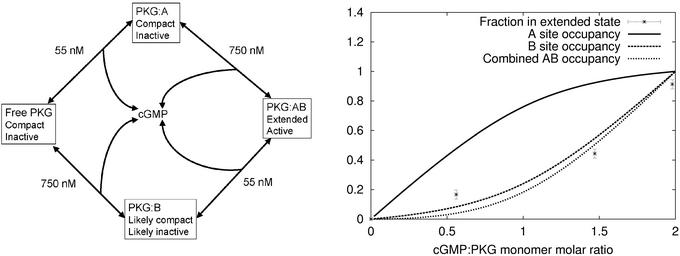
Figure 4.
Modeling the cGMP-dependent elongation of PKG. (Left) Model of cGMP binding to monomeric PKG that is used to generate binding curves. States are annotated with respect to size and activity. (Right) Extended state occupancy vs. cGMP:PKG ratio for monomeric PKG. Predicted binding site occupancy curves for cGMP binding to site A, site B, and sites A and B combined are shown. In our experiments, the PKG:B state and the PKG:AB state cannot be distinguished.

