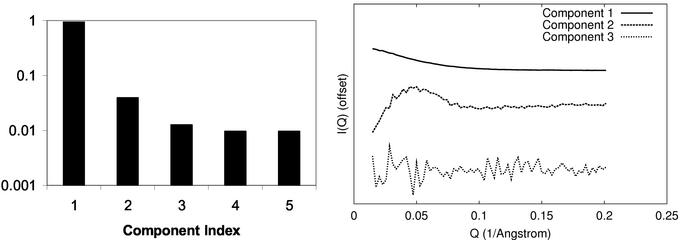
Figure 5.
Singular value decomposition analysis of cGMP titration data. (Left) Normalized singular values are shown for SVD of the titration data. The first two components account for 96% of the signal. (Right) The first three SVD components of the scattering signal for the titration data are shown offset, sorted top-to-bottom. The third component and higher are dominated by noise. Combined, these plots provide evidence that the titration data are explained by two underlying signals, consistent with a two-state model of the elongation.

