
Fig. 3.
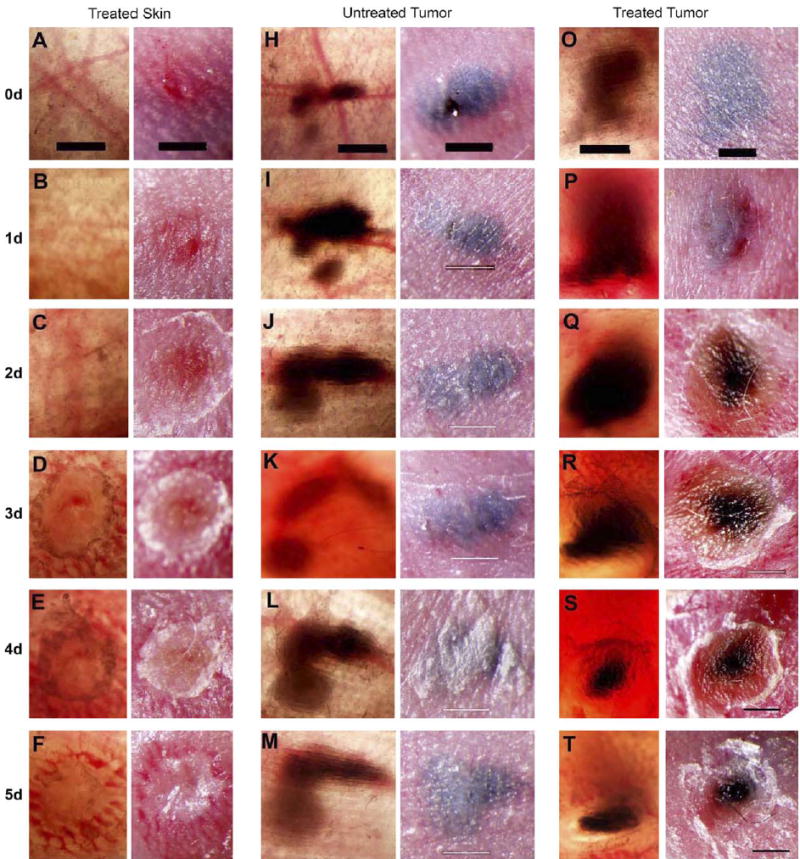
Typical response of skin and melanoma to one or two applications of 100 pulses using a 5-needle array electrode on mouse #56. Each matched pair of photographs represents an in vivo transillumination of the skin on the left and a surface view on the right. Numbers on the far left indicate the number of days after pulsing at which all three matched pairs to the right were photographed. (A–F) The typical response of normal skin to 100 pulses (300 ns long, 20 kV/cm, 0.5 Hz) delivered on day 0. Small superficial erosion in (B) grows in (C–E) and indicates loss of some or all epidermis. (H–M) The electrode array was inserted into this tumor on day 0 but no pulses were delivered. (O–T) One hundred pulses (300 ns long, 20 kV/cm) were delivered at 0.5 Hz on day 0 and day 1. Necrosis evident on day two becomes more intense over time. Scale bars (A–T) 1 mm and all photographs in a given row are at the same magnification.