
Fig. 5.
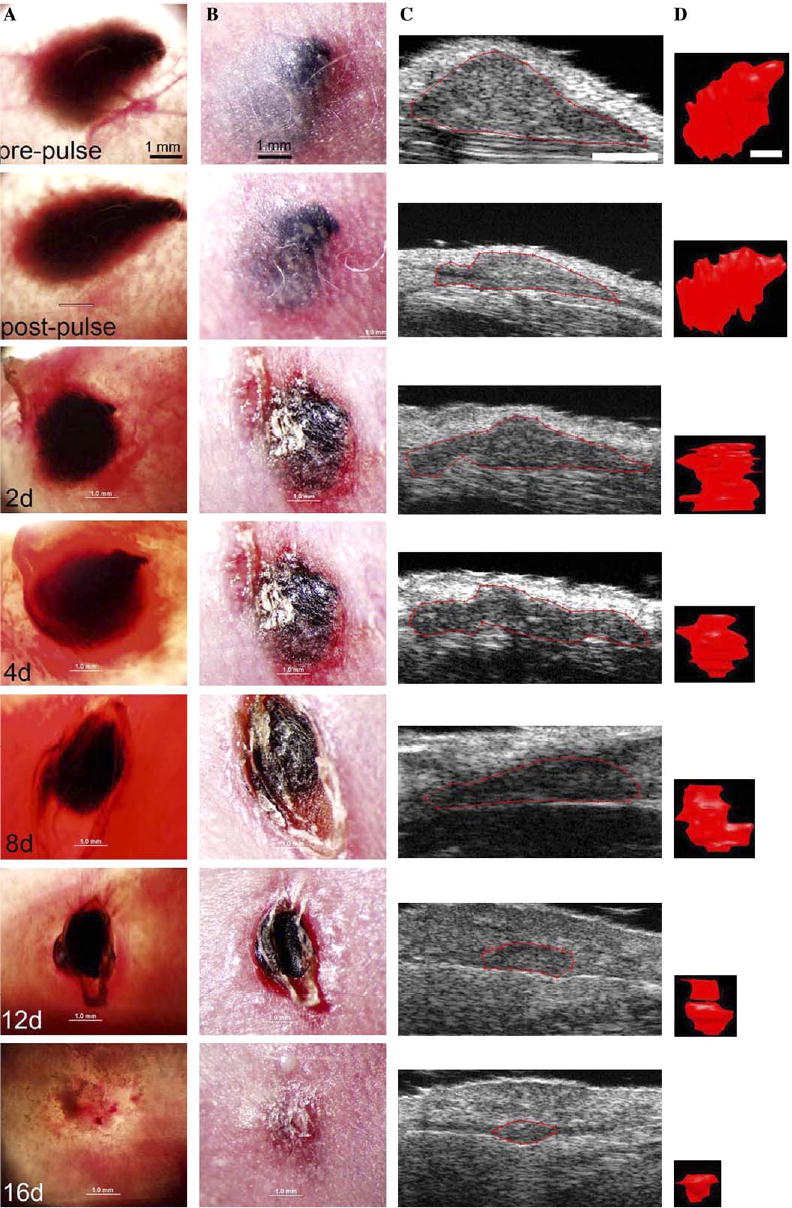
Typical response of a melanoma to three applications of 100 pulses (300 ns, 40 kV/cm, 0.5 Hz) 30 min apart on day 0 followed by a single application on day 4 using a 5 mm diameter parallel plate electrode on mouse #102. Collection of seven matched sets of images of the same tumor all taken on the day indicated in the lower left corner of the transillumination image. (Column A) Transillumination image. (Column B) Surface view. (Column C) Ultrasound slice at center of tumor; (column D) 3-D reconstruction made from 100 serial ultrasound slices through tumor. Magnification is constant for each column and scale bar at top of each column represents 1 mm.