
Fig. 9.
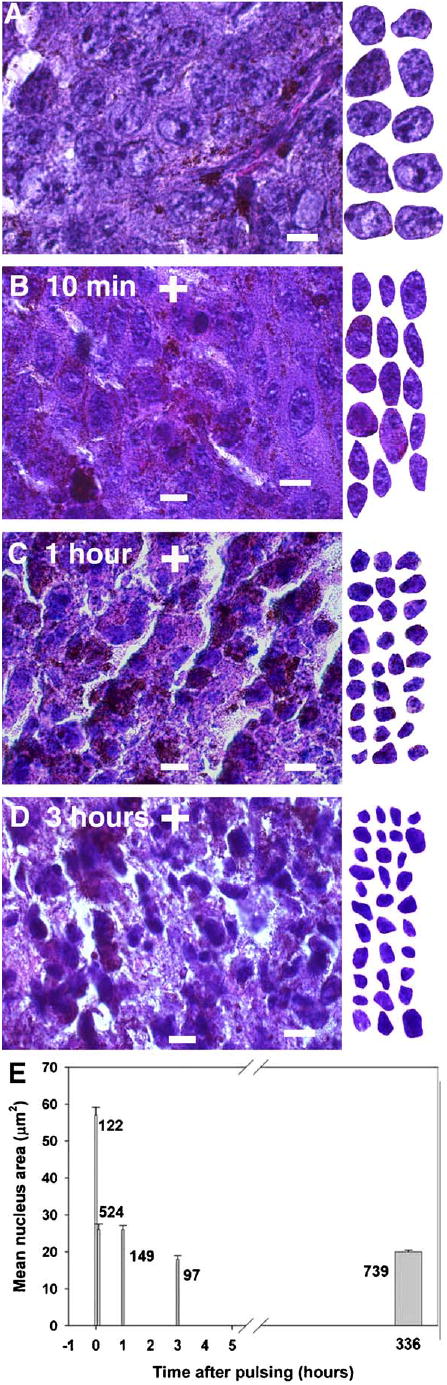
Targets and mechanisms of nsPEF effects. (A–D) Seven micrometer thick paraffin sections of control and treated melanomas fixed at the indicated time after treatment with 100 pulses (300 ns, 40 kV/cm, 0.5 Hz) stained with hematoxylin and eosin. The clearest nuclei were copied and placed to the right of each section to assist in size comparison. (A) Control tumor section; (B) 10 min post-treatment (C) 1 h post-treatment. (D) Three hours post-treatment. Scale bars: 10 μm. (E) Mean nuclear area versus time after 100–200 pulses were applied. Number of cell nuclei measured from at least two mice for each time point indicated next to each column and bars represent SEM. Breakin time is 330 h. There is a significant difference between the 0 h prepulse control and all of the other time points (p < 0.001) as well as between 1 and 3 h (p < 0.001). There is no significant difference between 0.1 and 1 h. Scale bars in (A)–(D): 10 μm.