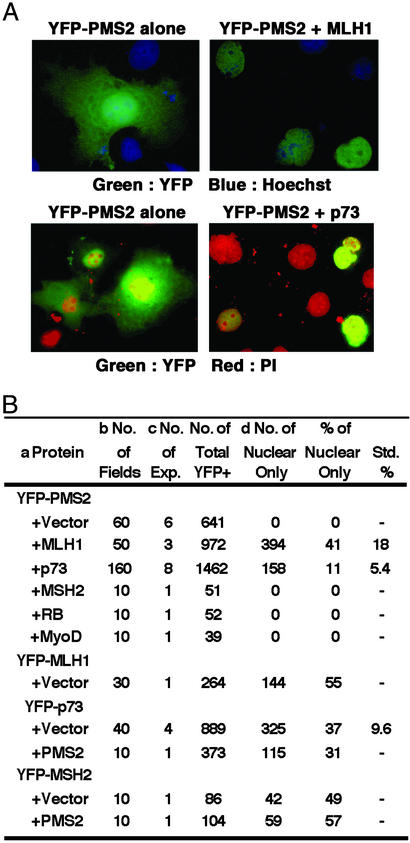
Figure 3.
MLH1 and p73 can influence the subcellular distribution of PMS2. (A) Merged image of YFP-PMS2 (green) and Hoechst (blue, Upper) or propidium iodide (red, Lower) of Cos-1 cells transfected with the indicated expression plasmids. (B) Quantification of the nuclear localization of YFP-PMS2. a, Each of the indicated proteins was expressed individually (+ vector) or in combination. Transfected cells were stained with Hoechst and visualized with a fluorescent microscope for YFP and nuclei. b, Ten fields were counted per experiment and, on average, each field contained ≈50 cells. c, The number of independent transfection experiments is shown. d, Nuclear-only YFP signal is depicted in A Right.

