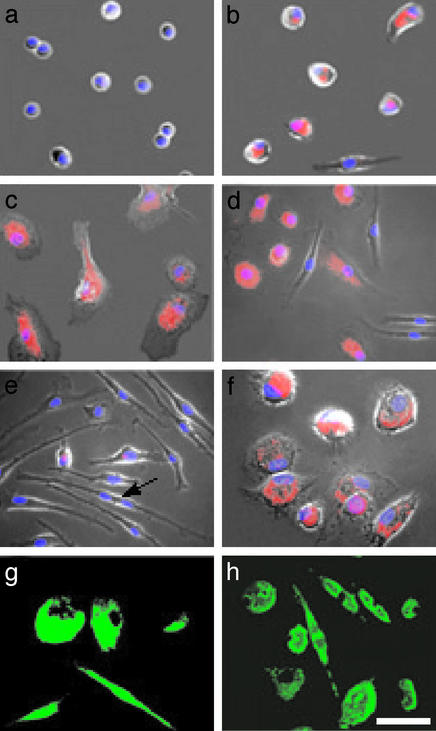
Figure 1.
Macrophage differentiation of peripheral blood monocytes. (a) Freshly isolated monocytes. (b) Untreated 5-d-old monocyte culture. (c) Five-day PMA-treated culture. (d) Five-day M-CSF-treated culture. (e) Fourteen-day M-CSF-treated culture; the arrow points to a dividing cell. (f) Fourteen-day M-CSF-treated culture incubated for 1 d with LPS. (g) MAC-1 immunostaining of 5-d M-CSF-treated culture. (h) Fluorescence of phagocytized beads in 5-d M-CSF-treated culture. (a–f) Cells visualized by phase-contrast microscopy merged with fluorescence images of lipids stained with Nile red (red) and nuclei stained with 4′,6-diamidino-2-phenylindole (DAPI, blue). (Scale bar, 40 μm.)

