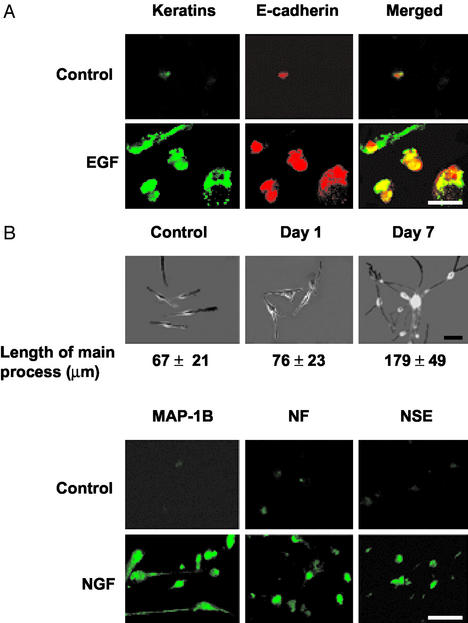
Figure 4.
Epithelial and neuronal cell differentiation of f-MΦ. (A) EGF-induced epithelial differentiation was assessed by double immunostaining for keratins (green) and E-cadherin (red). Each field contains four to five cells. The control panel was selected to include a positive cell. (B) NGF-induced neuronal differentiation was assessed by length of the main processes (mean ± SD) of 50 randomly selected cells by using SLIDEBOOK software (Upper) and by immunostaining for neuron-specific antigens (Lower). Each immunostained field contains 10–15 cells with the control panel selected to contain positive cells. (Scale bar, 50 μm.)

