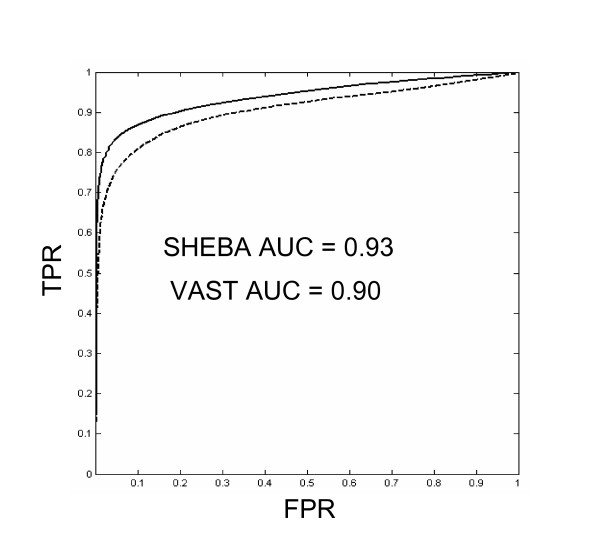
Figure 1.

ROC Curves. ROC curves of VAST (dotted line) and SHEBA (solid line) obtained by plotting the True Positive Rate (TPR, eq. 1, see Methods) against the False Positive Rate (FPR, eq. 2, see Methods). Area Under the Roc Curve (AUC) for VAST is 0.90, AUC for SHEBA is 0.93.
