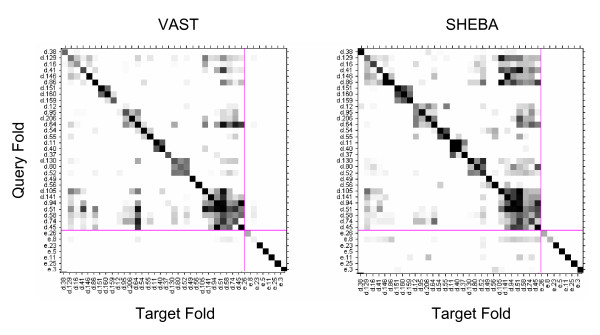
Figure 10.

Confusion matrix heat map for the D class. Confusion matrix heat map for the D class for VAST and SHEBA showing clusters of confused SCOP folds. The fold identifiers appear on the x and y axis. Grey scale from white to black for positive rates from 0 to 1.
