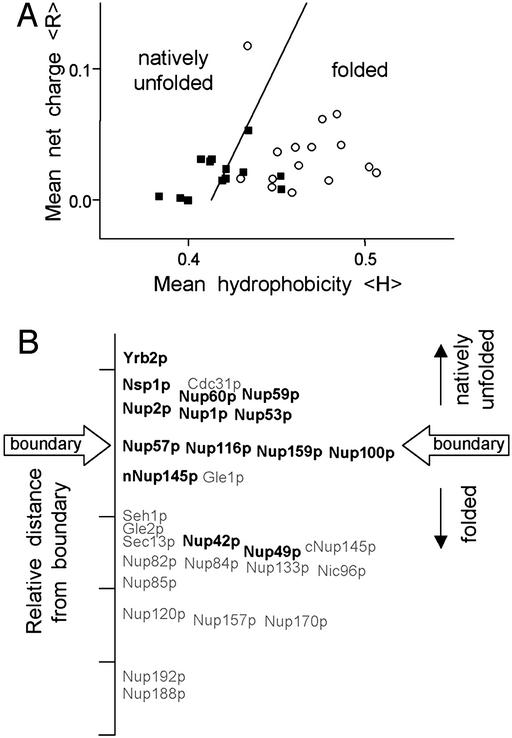
Figure 1.
Computer analysis of the hydrophobicity and net charge of all S. cerevisiae Nups predicts that the FG Nups are unfolded in physiological conditions. (A) Charge versus hydrophobicity plot. The mean net charges and mean hydrophobicities (Kyte-Doolittle, 5-aa window) were calculated and plotted for FG Nups (■) and non-FG Nups (○) as described (11). The line, 〈H〉b = (〈R〉 + 1.151)/2.785, demarcates the observed boundary between folded and natively unfolded proteins in the charge-hydrophobicity plot. The relative distance to the boundary line for individual FG Nups (bold type) and non-FG Nups (gray type) is shown on a linear axis in B.

