
Figure 2.
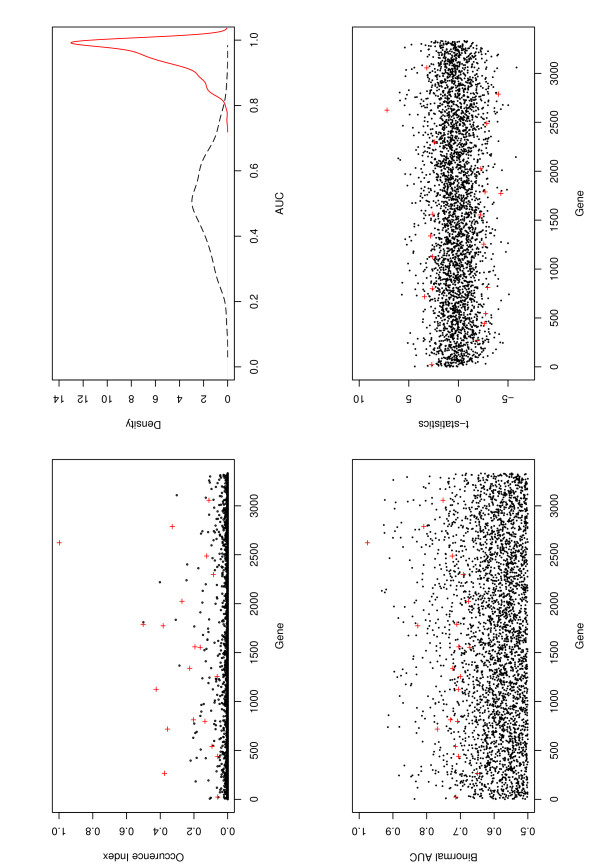
Estrogen data. X axis: natural order of genes. Left-lower panel: occurrence index, red "+": genes identified with the TGDR. Right-lower panel: kernel density estimation of the OPD (solid line) and PPD (dashed line) of AUC. Left-lower panel: Binormal AUC of every gene. Lower-right panel: t-statistics of every gene.