
Figure 5.
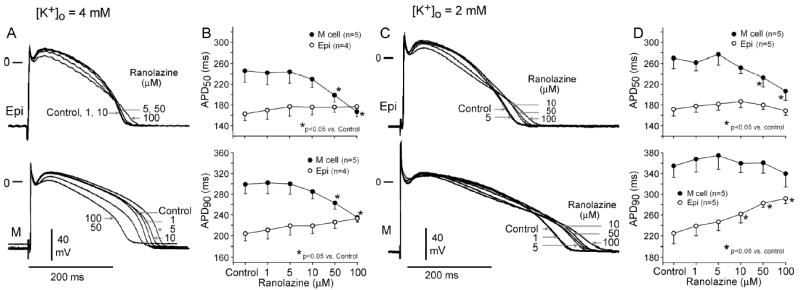
Left Panel: 4 mM [K+]o. Effects of ranolazine on epicardial and M cell action potentials. A: Superimposed transmembrane action potentials recorded under control conditions and following the addition of progressively higher concentrations of ranolazine (1–100 μM). B: Concentration-response curves for the effect of ranolazine on action potential duration (APD50 and APD90). Right Panels: 2 mM [K+]o. Effects of ranolazine on epicardial and M cell action potentials recorded at a pacing cycle length of 2000 ms and [K+]0 = 2 mM. C: Shown are superimposed transmembrane action potentials recorded in the absence and presence of ranolazine (1–100 μM). D: Concentration-dependent effect of ranolazine on action potential duration (APD50 and APD90). BCL=2000 ms. Data presented as mean ± SEM.