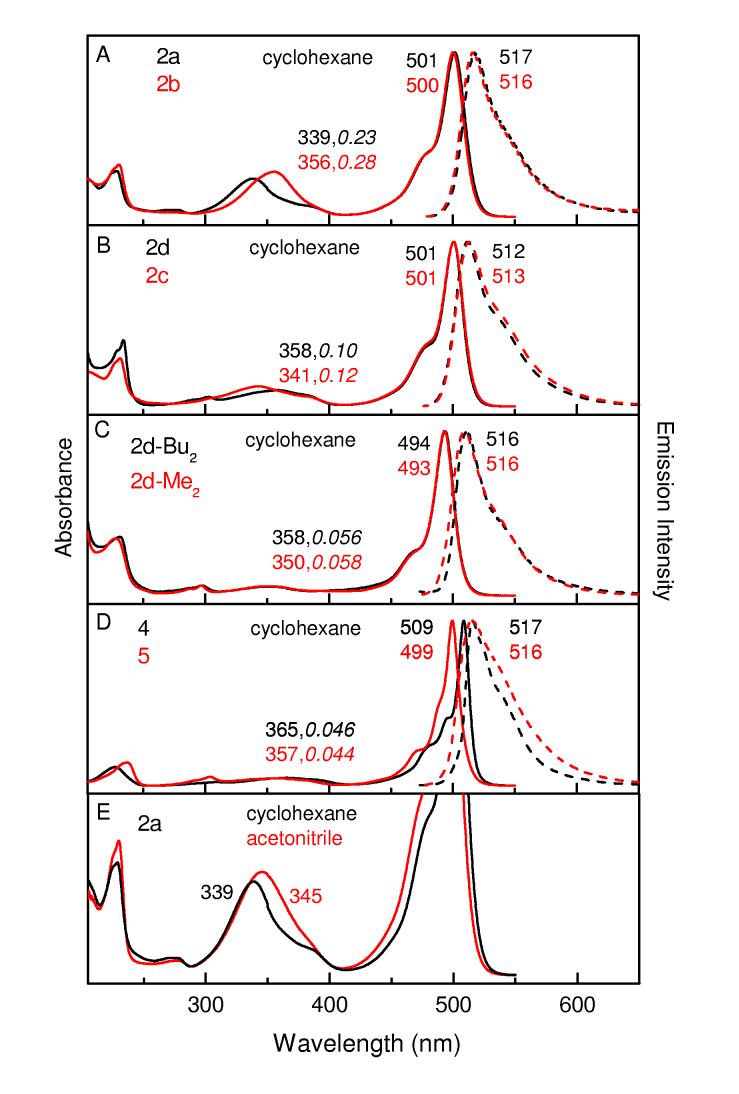
Figure 2.
Room temperature electronic absorption spectra (solid) and fluorescence spectra(dashed) of boron-dipyrrin dyes. The peak wavelengths are indicated. The second value indicated for the absorption in the 300-400 nm region in panels A-E is the peak amplitude compared to the maximum of the lowest-energy transition in the 490-510 nm region. The fluorescence spectra were acquired using an excitation wavelength of 450-460 nm. The spectra in panel E are vertically enhanced ∼3-fold from the other panels to emphasize the solvent dependence of the spectra in the 300-400 nm region.

