
Figure 2. Secondary structure in the nascent RNA is suppressed at high force.
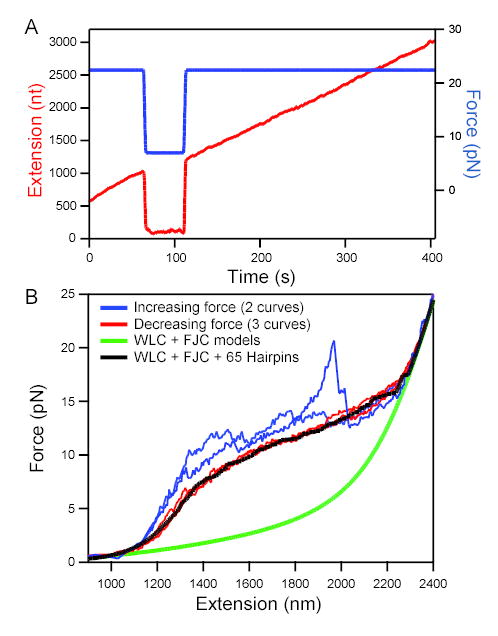
(A) RNA extension (red; left axis) vs. time at high and low loads. Elongation took place at an initial force of 22 pN (blue; right axis). When force was reduced to 7 pN at 75 s, apparent elongation ceased. When high force was restored at 110 s, extension returned to the position extrapolated from earlier elongation, showing that transcription had continued during the low-force period with no significant change in extension as secondary structure formed.
(B) Force-extension curves (FECs) for a tether that had stalled prematurely (taken at ~120 nm/s). Stretching curves (increasing force; 2 examples shown) displayed distinct features with each pull (blue traces). In contrast, relaxation curves (decreasing force; 3 examples shown) displayed very reproducible behavior (red traces). Model FECs: A worm-like chain (WLC, representing dsDNA) plus a freely-jointed chain (FJC, fit to 2,200 nt ssRNA) fits the data only in low and high force limits (green line). The additional effect of forming 65 random hairpins (loop 4 nt; Gaussian distribution of stem lengths centered at 10.5 bp, std. dev. 3 bp) reproduces the plateau seen in the experimental data (black line) (see Supplemental Material).