
Figure 4. Force dependence of velocity, pause characteristics, and processivity.
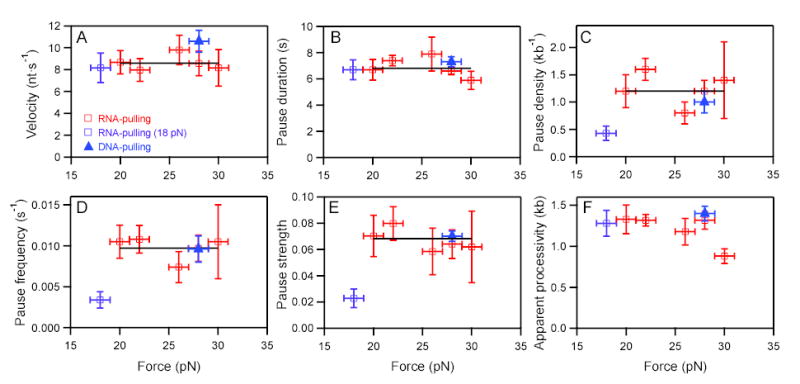
RNA-pulling data (open squares), DNA-pulling data (filled triangles). Fits to weighted means (black horizontal lines) rather than to lines (nonzero slope) were justified by F tests. The low force point at 18 pN was excluded from fits because it was deemed too close to the opening force for the most stable hairpins. Estimated errors represent std. errs. in (A, B) and bootstrap errors in (C-F).
(A) Mean velocity vs. force; avg. = 8.6 ± 0.7 nt/s.
(B) Mean pause duration vs. force; avg. = 6.9 ± 0.2 s.
(C) Pause density vs. force; avg. = 1.2 ± 0.1 kb−1.
(D) Pause frequency vs. force; avg. = 9.7 ± 0.9 ×10⁻³ s−1.
(E) Pause strength (pause duration multiplied by frequency) vs. force; avg. = 68 ± 7 ×10⁻³.
(F) Apparent processivity (distance to tether rupture) vs. force.