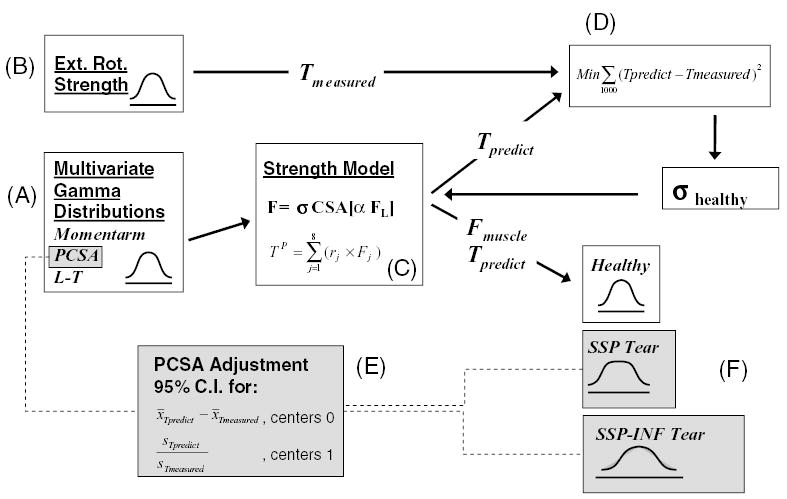
FIGURE 1.

Diagram depicting the Monte Carlo model. (A) Multivariate Gamma distributions generated from summary statistics of moment arm, PCSA, and the muscle length–tension dependencies measured in our lab. (B) Gamma distributions for joint strength constructed from measured external rotation joint strength. (C) Predicted muscle force and joint strength relationships described in the text. (D) Muscle specific tension predicted for the healthy normal case (and assumed for all cases) using the method of Chang et al.14 (E) The nonparametric 95% confidence interval adjustment of PCSA input distributions to ensure measured and predicted torques matched for the two rotator cuff tear cases. (F) Muscle force and joint torque distributions predicted with the model for the three cases.
