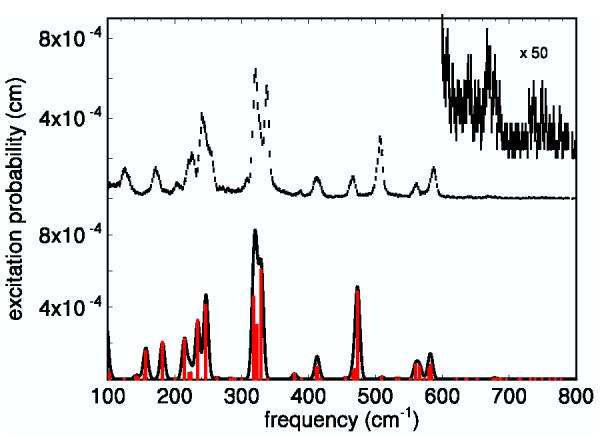
Fig. 2.

Measured and predicted Fe vibrational spectra for Fe(TPP)(1-MeIm)(CO). Upper scale: Measured excitation probability S(v̄) with error bars. Lower scale: One-phonon contribution predicted by DFT. The red bars represent the relative areas of the individual 8 cm-1 FWHM Gaussian contributions to the solid curve, calculated from Eq. 2.
