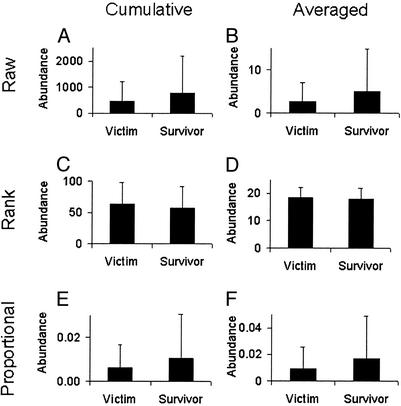
Figure 1.
Mean (±SD) abundance for K/T victims and survivors across all localities at the subgeneric rank. No significant differences in abundance between victims and survivors were recorded, regardless of the abundance metric (raw, rank, or proportional) or statistical test (Mann–Whitney, Kolmogorov–Smirnov, or t test with data transformation) used and regardless of whether the data were treated cumulatively or averaged. It should be noted that, because the nonparametric tests involve ranking of the data, they do not differentiate among the three abundance metrics when the data are treated cumulatively. (A) Raw abundance data with cumulative data treatment (U64,57 = 1617, P = 0.28; D64,57 = 0.15, P > 0.10; t1,119 = −1.19, P = 0.24). (B) Raw abundance data with average data treatment (U64,57 = 1586, P = 0.22; D64,57 = 0.17, P > 0.10; t1,119 = −1.39, P = 0.17). (C) Rank abundance data with cumulative data treatment (t1,119 = 1.12, P = 0.26). (D) Rank abundance data with average data treatment (U64,57 = 1683, P = 0.46; D64,57 = 0.15, P > 0.10; t1,119 = 0.71, P = 0.48). (E) Proportional abundance data with cumulative data treatment (t1,119 = −1.19, P = 0.24). (F) Proportional abundance data with average data treatment (U64,57 = 1,609, P = 0.26; D64,57 = 0.16, P > 0.10; t1,119 = −1.35, P = 0.18).

