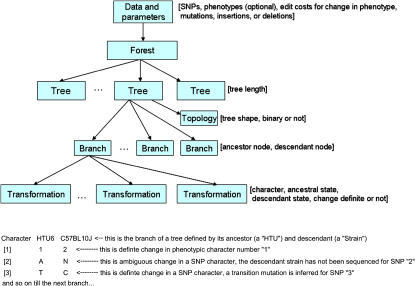
Figure 1.
(Top) The data model for the output from POY, a program for phylogenetic tree optimization. The rectangles and arrows represent the element types and parent-child relationships. The contents of the square brackets denote the attributes associated with a node type. For example, a branch element type has attributes for the ancestor node, the descendant node, and the minimum and maximum length as computed by the POY program. (Bottom) An annotated example of section of tabular POY output depicting inferred transformations in three characters on a branch of a phylogenetic tree. Character 1 is a phenotype that changed from state 1 in the ancestor (HTU6) to state 2 in the descendant (strain C57BL10J). This change could be from normal to elevated non–high-density lipoprotein cholesterol plasma levels. Character 2 is a single nucleotide polymorphism (SNP), in which change could have occurred along this branch but is ambiguous due to missing data. Character 3 is an SNP, in which a transition mutation occurs. This could be SNP rs3023213 as depicted in ▶.

