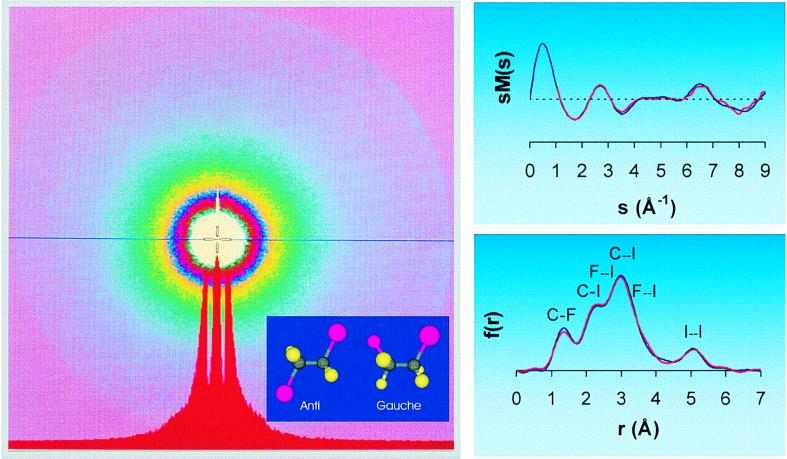
Figure 1.
(Left) The two-dimensional diffraction image of C2F4I2 molecule recorded with the ultrashort electron pulses. An intensity profile across the image is also displayed at the bottom. The inset shows the structures of the two isomers. (Right) The experimental sM(s) and f(r) curves at t = −150 ps (red lines). The blue lines represent the theoretical calculations (see text). The different internuclear separations relevant to the chemical reaction under study are also shown in f(r).

