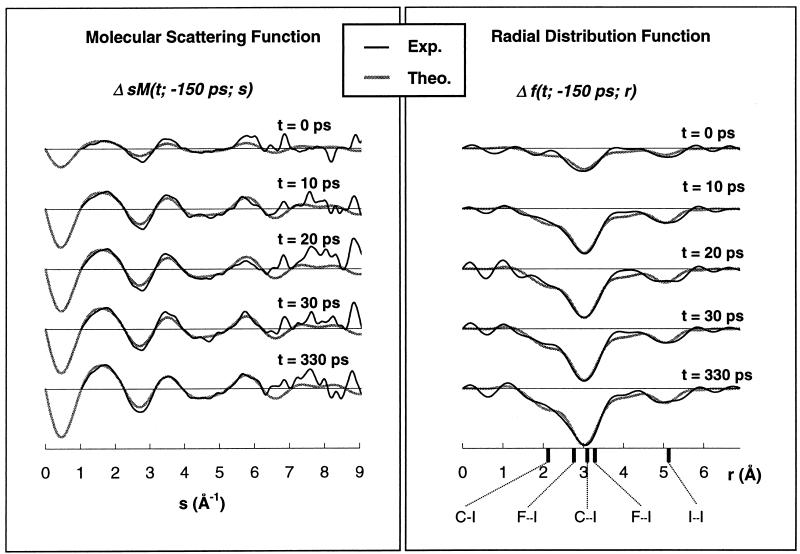
Figure 2.
The experimental diffraction-difference ΔsM(t; −150 ps; s) (Left) and Δf(t; −150 ps; r) (Right) curves at different reaction times referenced to the parent C2F4I2 data at −150 ps (solid lines). The shaded lines are the theoretical difference curves. The reaction time t is indicated, and the relevant internuclear distances are also displayed.

