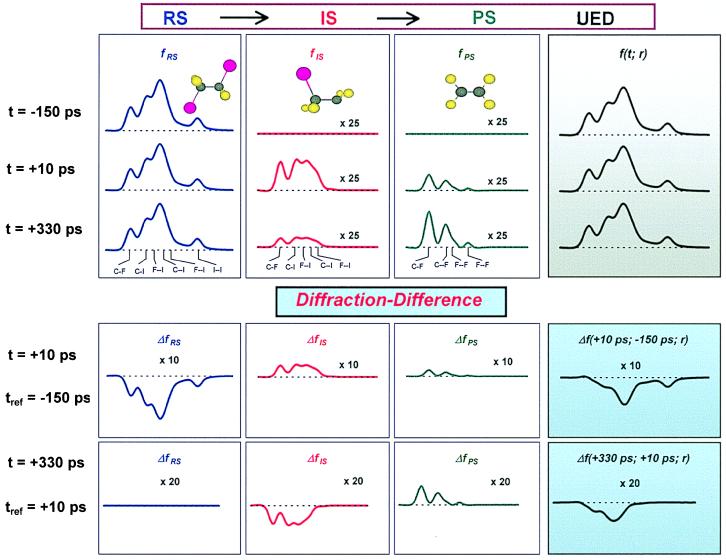
Figure 3.
(Upper) The temporal evolution of the reactant, the intermediate, and the final product. The changes of the individual internuclear separations and the associated molecular structures are also shown. (Lower) Diffraction difference curves, labeled by the time of the reaction (t) and the reference time (tref).

