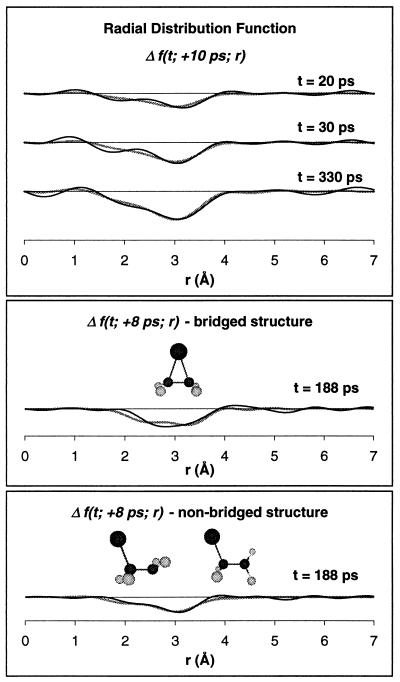
Figure 4.
(Top) The experimental diffraction-difference Δf(t; +10 ps; r) curves at different reaction times referenced to tref = +10 ps (solid lines). Shaded lines are the theoretical difference curves. (Middle and Bottom) The comparison between theoretical and experimental Δf(t; +8 ps; r) for the two structures, the bridged (Middle), and the classical, non-bridged (Bottom) structure. The experimental data in the lower two panels are identical; the difference in appearance is because of values of zero points of ΔI determined by the theoretical analysis (see refs. 8, 17, and 18). The reaction time t is indicated on each curve.

