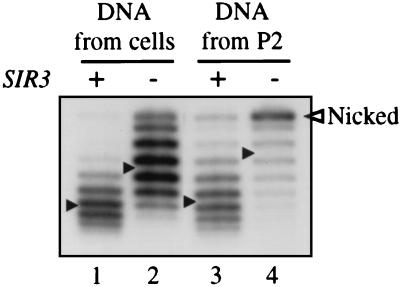
Figure 4.
Topoisomer analysis of partially purified chromatin rings. Electrophoresis was performed in buffer containing 1.5 μg/ml chloroquine. Samples were obtained from strains described in Fig. 3. (Lanes 1 and 2) DNA isolated directly from intact cells. (Lanes 3 and 4) DNA isolated via P2 pellets that were obtained in RI buffer containing 150 mM KCl and 10% glycerol. Topoisomer bands were quantified by phosphorimaging (Bio-Rad), and the centers of the topoisomer distributions (marked with filled arrows) were determined by the Gaussian method (44).

